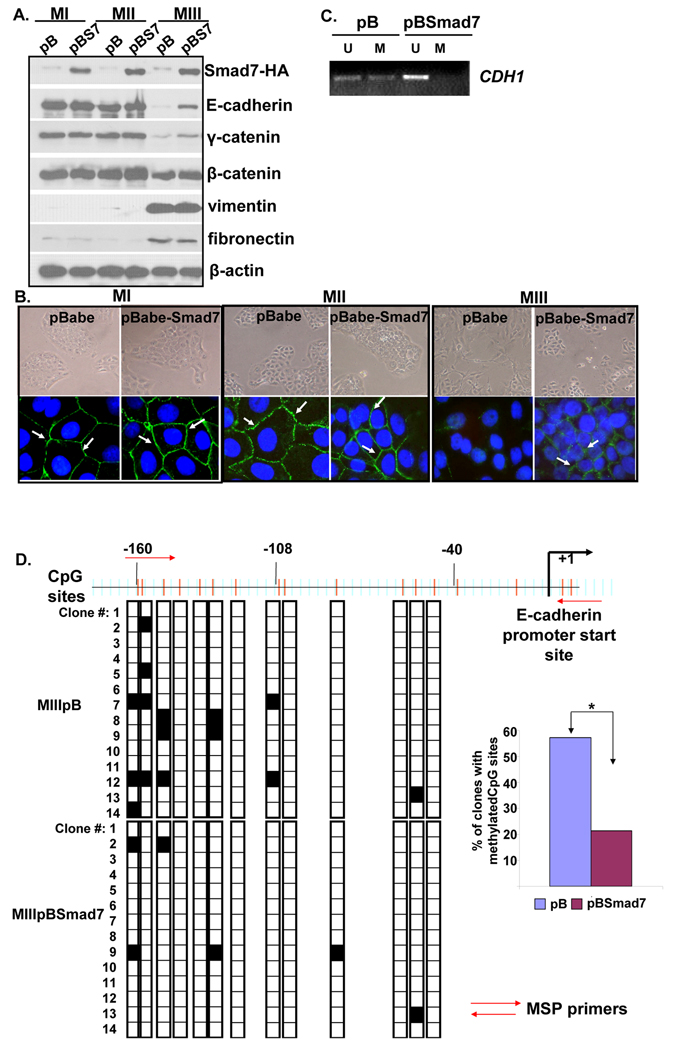
Figure 2. Smad7 overexpression induces promoter DNA demethylation and re-expression of E-cadherin.
A. Western blotting analysis to detect stable overexpression of exogenous Smad7, epithelial and mesenchymal markers in MI, MII and MIII cells. B. Smad7 overexpression induces epithelial morphology in mesenchymal-like MIII cells and localization of E-cadherin at the cell-cell junctions. Representative examples of light microscopy (10X) and immunofluorescence images (100X) generated using an anti-E-cadherin primary and FITC-conjugated secondary antibodies in the MI, MII and MIII cells stably transfected with either pB or pBSmad7 vectors. Cell nuclei were stained with DAPI (blue). Localization of E-cadherin (green) at the cell-cell junctions is indicated by white arrows. C. Semi-quantitative MSP analysis of the −160 to +1 CDH1 promoter region using bisulfite-treated genomic DNA. D. Mapping of the methylated CpG dinucleotides within the −160 to +1 CDH1 promoter region by analyzing 14 clones each from the bisulfite-treated templates derived from the MIIIpB and MIIIpBSmad7 cells. White and black squares represent unmethylated and methylated CpGs, respectively. Bar chart shows percentages of clones that exhibited at least one methylated CpG in relation to the total number of clones sequenced.

