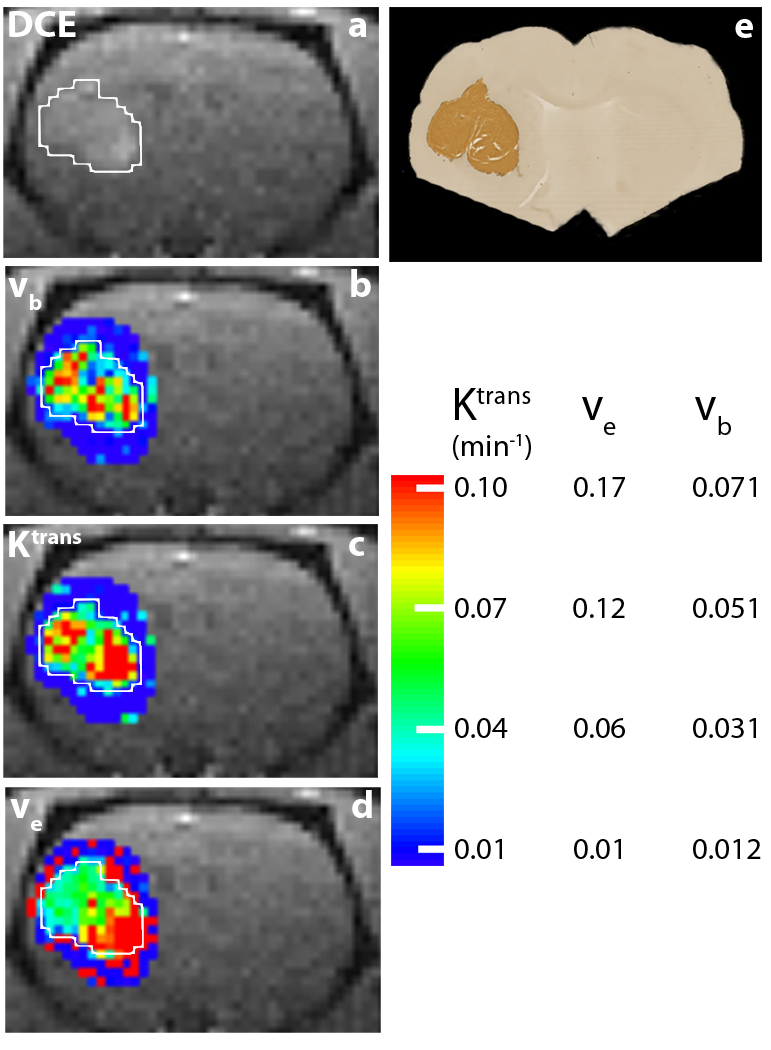
Figure 7.
Panel a shows the 1.2 min DCE coronal-equivalent image of the head of animal #6. The U87 tumor is clearly visible in the left brain (right side of image), and the lesion ROI is circumscribed with a white border. Panel b shows the vb map derived from fitting the CR first-pass DCE data (spanning the first ~ 1.2 min of acquisition) with two variable parameters: Ktrans, and vb. The tumor vb values are elevated from those of surrounding brain parenchyma (dark blue, ~0.01). With vb and Ktrans held fixed and set as the initial guess, respectively, at the first-pass fitted values for each pixel, two parameter BALDERO fittings of the entire (~5 min.) data time-courses were performed with Ktrans and ve as variables. Panels c and d show the Ktrans and ve maps from these. The panel d map demonstrates the detectable ve in the tumor (~0.15) and poor ve parameter definition outside of the tumor. It is particularly interesting that Ktrans is more extensively at its maximum (~ 0.17 min−1) in the inferior lobe, as is ve. The color bar at the bottom right shows the scales for all three parametric maps. The darker brown color in panel e shows human mitochondria staining of the same animal brain in a histological slice comparable to that of the DCE image slice.

