Figure 1.
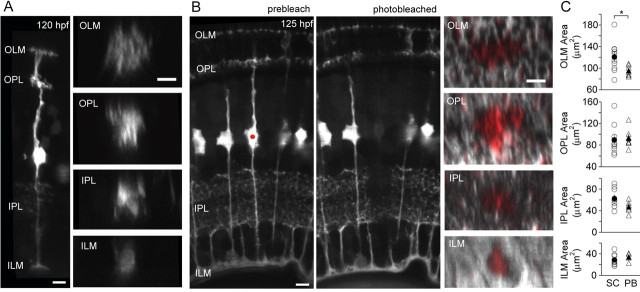
MG territories do not overlap in retinal synaptic layers. A, Maximum projection of a multiphoton image stack encompassing a single MG at 120 hpf labeled by transient expression of GFP. Orthogonal rotations (right column) of the image stack showing MG territories at the OLM and ILM and within the synaptic layers, the OPL and IPL. B, A single MG (red dot) in the gfap:GFP transgenic line was photobleached using an IR laser. In orthogonal rotations of the MG territories at various retinal depths, the coverage of the photobleached cell is highlighted in red. The image stack before bleaching (pseudocolored red) was digitally overlaid with the image stack after photobleaching (grayscale) using AMIRA software. C, Territories occupied by a single MG obtained by transient GFP expression (SC) are compared to areas revealed upon photobleaching one cell (PB). *p = 0.024. Open symbols indicate individual cells. Closed symbols indicate the mean. Error bars are SEM. Number of cells visualized by GFP and photobleaching respectively: OLM (11,7), ILM (9,4), OPL (10,7), IPL (9,6). All scale bars, 5 μm.

