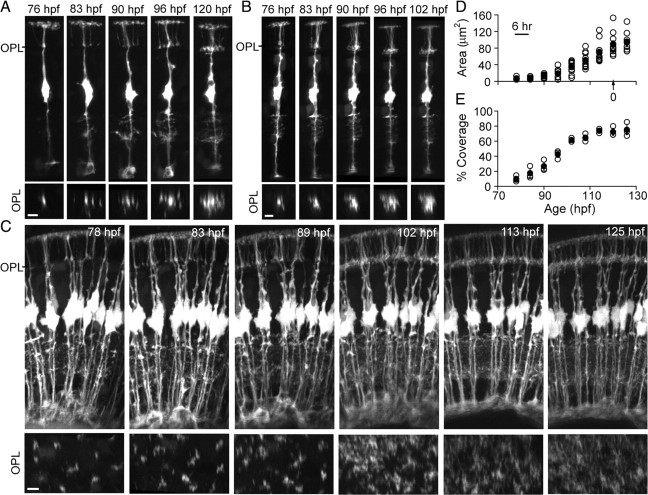
Figure 3.
MG processes in the OPL are the last to mature. A, B, Time course of OPL territory development for two examples of MGs visualized by transient expression of GFP. Orthogonal rotations of each image stack at the level of the OPL (OPL image sequence) provide a lateral view of the MG territory at each time point. C, Time course of MG process infiltration into the OPL for the entire population of MGs imaged from the ventrotemporal retina. Orthogonal rotations show coverage of the OPL by elaborating MG processes. D, Time course of MG arbor elaboration within the OPL, normalized across multiple cells. Time “0” (arrow) is the age at which each cell first demonstrated a stable and maximal arbor. Maximal arbor formation occurred between 90 and 120 hpf. Open symbols indicate individual cells. Closed symbols indicate the mean. Error bars are SEM. E, Time course of MG process occupancy within the OPL obtained by imaging MGs in the gfap:GFP transgenic line. MG process infiltration was calculated by counting the fraction of pixels above a manually set threshold. Open symbols indicate individual retinas. Closed symbols indicate the mean. Error bars are SEM. All scale bars, 5 μm.

