2.
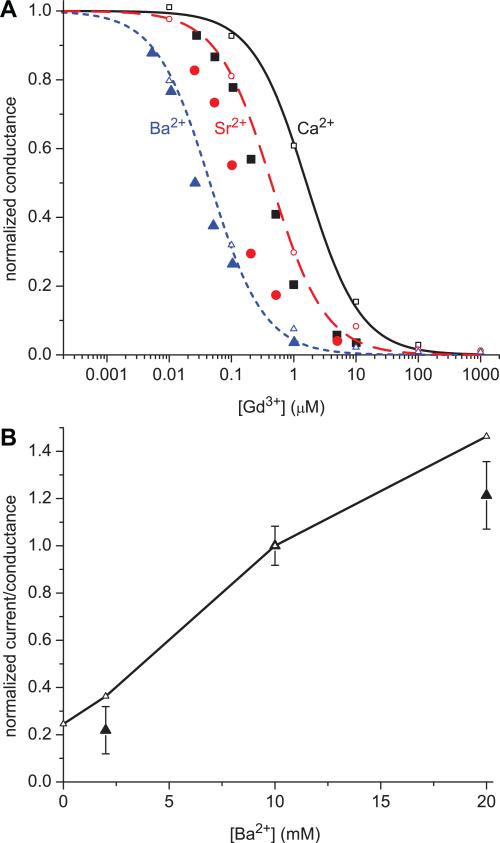
Comparison of the normalized currents from experiments (large, solid symbols) to normalized conductances computed from the model (small, open symbols). (A) In the simulations there is 150 mM NaCl, the indicated concentration of GdCl3, and 10 mM divalent cation: Ca2+ solid (black) curve and square (black) symbols; Sr2+ dashed (red) curve and circle (red) symbols; Ba2+ dotted (blue) curve and triangle (blue) symbols. The lines are fits of the model results to Eq. (5) with the conductance normalized by the value in the absence of Gd3+. (B) In the simulations there is 150 mM NaCl, 25 nM GdCl3, and the indicated concentration of BaCl2. The conductances are normalized to the value with [Ba2+] = 10 mM.

