4.
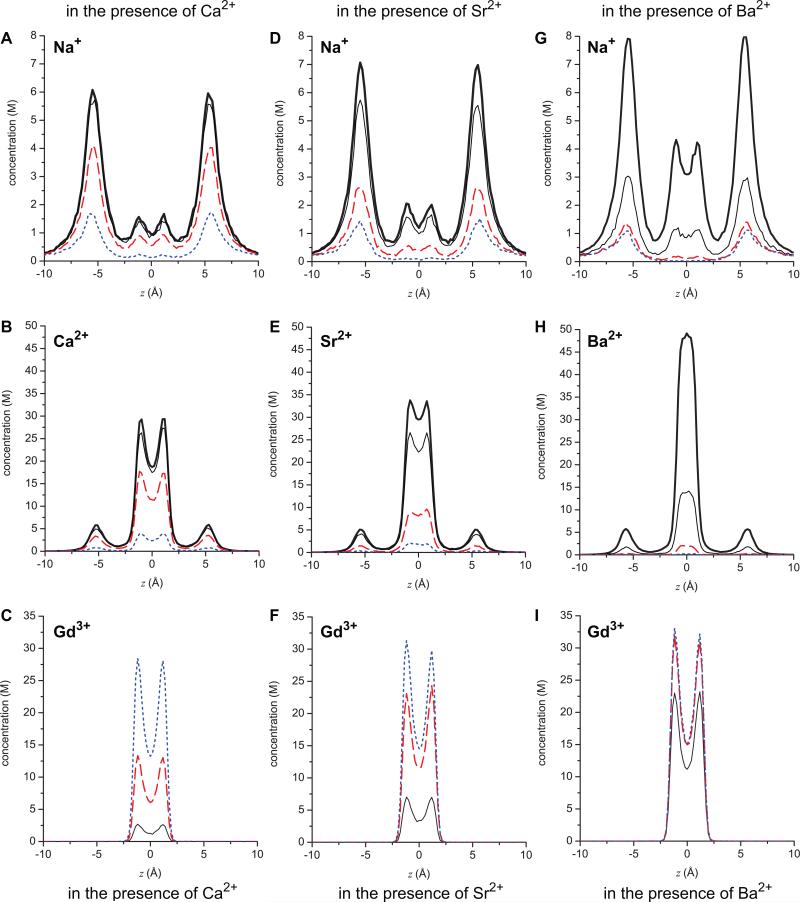
Concentration profiles of ions in the pore: top row (A, D, G) Na+; middle row (B, E, H) divalent M2+; bottom row (C, F, I) Gd3+. The left column (A, B, C) are when the divalent is Ca2+, the middle column (D, E, F) Sr2+, and the right column (G, H, I) Ba2+. The thick black line is when [Gd3+] = 0, the thin black line when [Gd3+] is 0.1 μM, the long-dashed (red) line when [Gd3+] is 1 μM, and the dotted (blue) line when [Gd3+] is 10 μM. These concentrations are given in molar instead of the line density used in Eq. (2). The area used to compute this molar concentration from the line density is the cross-sectional area accessible to the center of each ion species.

