5.
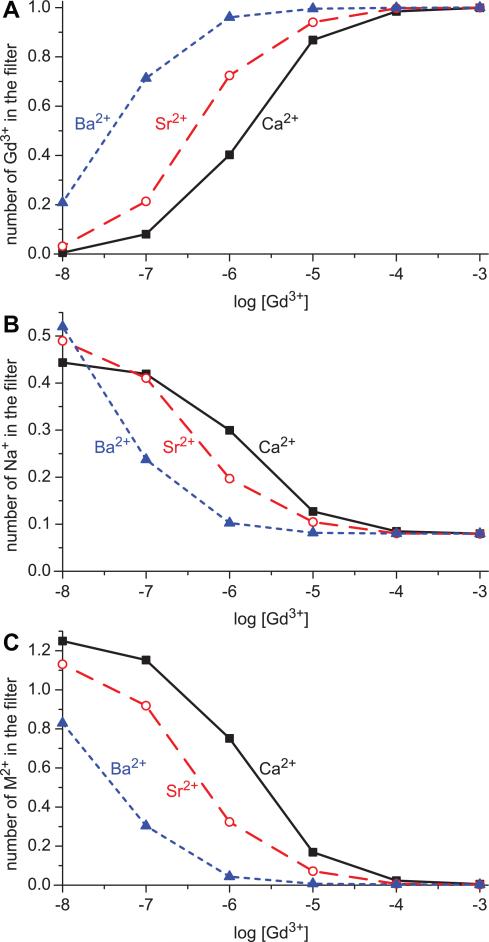
Occupancy of each cation species in the selectivity filter (–5 Å < z < 5 Å in Fig. 1) when different divalents are present: Ca2+ solid (black) curves and square (black) symbols; Sr2+ dashed (red) curves and circle (red) symbols; Ba2+ dotted (blue) curves and triangle (blue) symbols. (A) The number of Gd3+ in the filter. (B) Na+. (C) divalents M2+.

