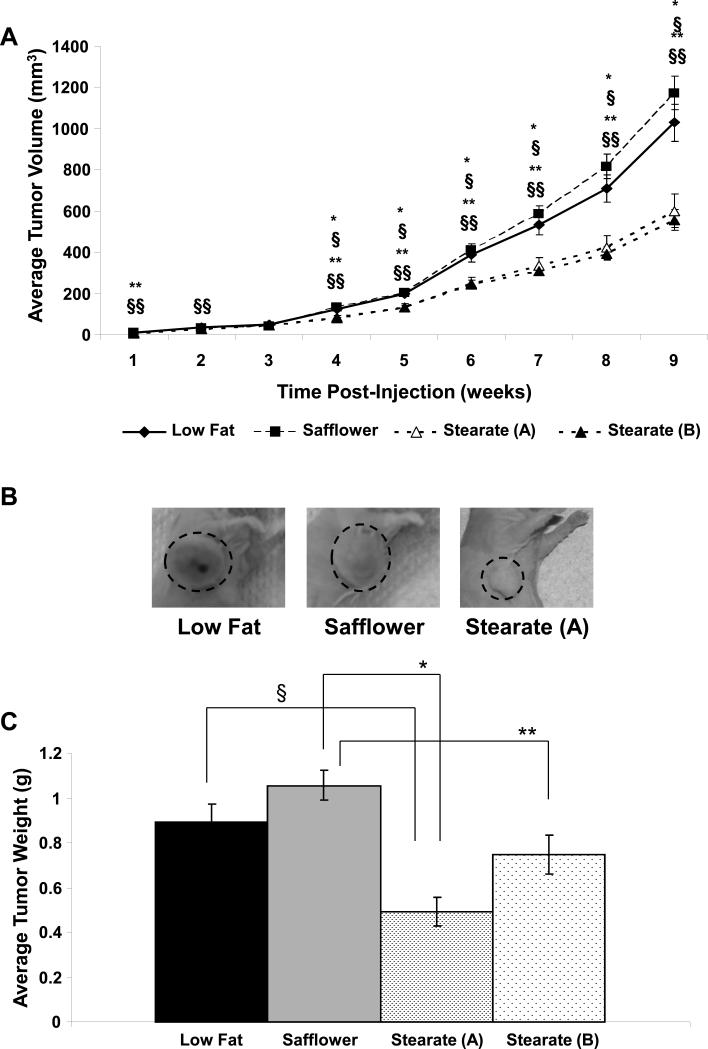
Figure 3. Tumor Weights and Volumes for the Low fat, Safflower, and Stearate (A) Groups.
A) Mammary fat pad tumors of the animals were measured weekly after injection. Based on the estimated volumes, stearate began to decrease the average volume of the tumors approximately 4 weeks post-injection. The stearate (A) and stearate (B) primary tumors were not different. (n=20-21 animals per diet; §p value of stearate (A) vs. low fat <0.009; §§p value of stearate (B) vs. low fat<0.021; *p value of stearate (A) vs. safflower <0.003; **p value of stearate (B) vs. safflower<0.015 by ANOVA). When the data were analyzed using a repeated measures model and the curvature of the data points were estimated, all diets were different at week 9 except low fat vs. safflower (p<0.05). B) Immediately prior to removal of the mammary fat pad tumors at week 9, photographs were taken of mice in the low fat, safflower, and stearate (A) groups. All three of these tumors were removed on the same day. Representative images are shown. Animals on the stearate (A) diet tended to have noticeably smaller tumors compared to the other two diets. C) Following tumor removal, tumors were weighed and averages were calculated for each dietary group. Note: safflower oil, low fat and stearate A primary tumors were removed at 9 weeks post injection while the stearate B group tumors were removed and weighed at 11, 12 and 13 weeks post injection of cells. No difference was seen between the low fat and safflower oil treated animals, the low fat and stearate (B) animals, or the stearate (A) and stearate (B) animals. Differences were observed between all other diets (n=20-21; §p value of low fat vs. stearate (A) <0.002; *p value of stearate (A) vs. safflower <0.001; **p value of stearate (B) vs. safflower <0.003 by ANOVA).

