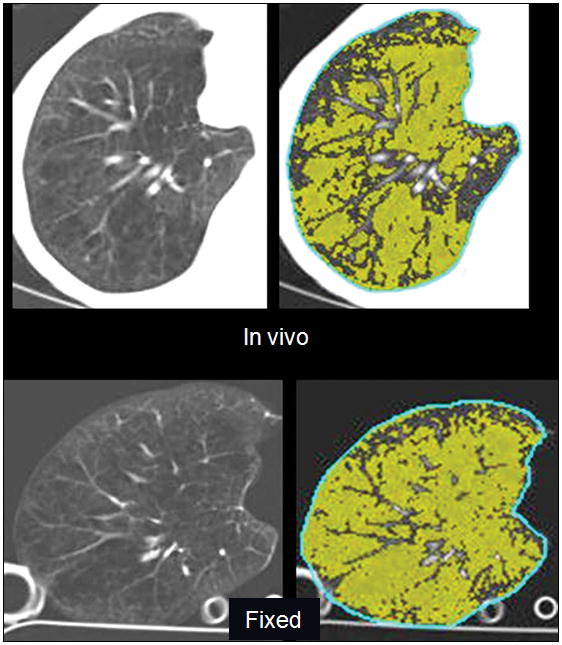
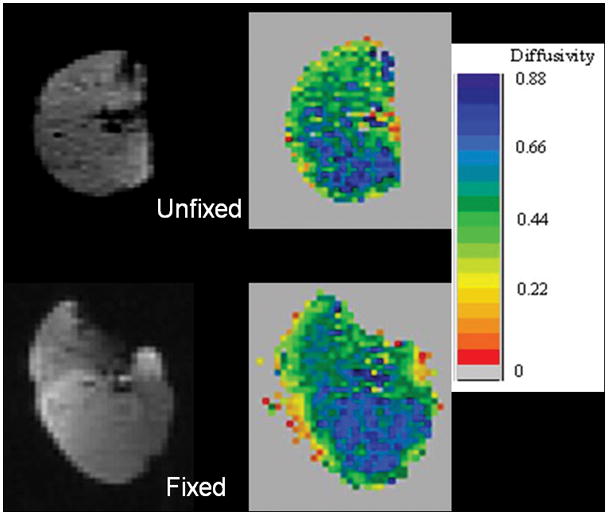
FIGURE 2.


A, CT images of right lung of a 58-year-old woman with severe emphysema obtained in vivo prior to transplantation, and after fixation of the explanted specimen, show a similar appearance of vascular anatomy and emphysematous changes (left), and similar areas of pixels with attenuation <−910 H (right, highlighted in green). Emphysema index for the whole lung was 62% in vivo and 76% in the fixed specimen. B, 3He MR images from same lung as in (A) show a uniform distribution of 3He signal on the 3He-density images (left). Despite a 15% increase in volume on the post-fixation images, note similar distribution of ADC values on ADC maps (right) before and after fixation. Mean whole-lung ADC was 0.55 cm2/sec before fixation and 0.54 cm2/sec after fixation.
