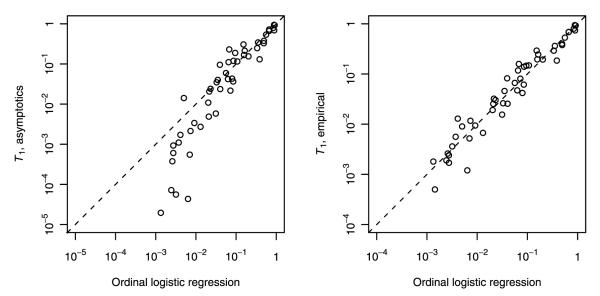
Figure 2.
Results of amblyopia data analysis. The x-axis is the p-value based on ordinal logistic regression with anisometropia treated as a continuous variable. The y-axisisthe p-value using T1. The left and right plots contain p-values based on the asymptotic and empirical distributions of T1, respectively. Each point represents results using a random sample of 50 children.

