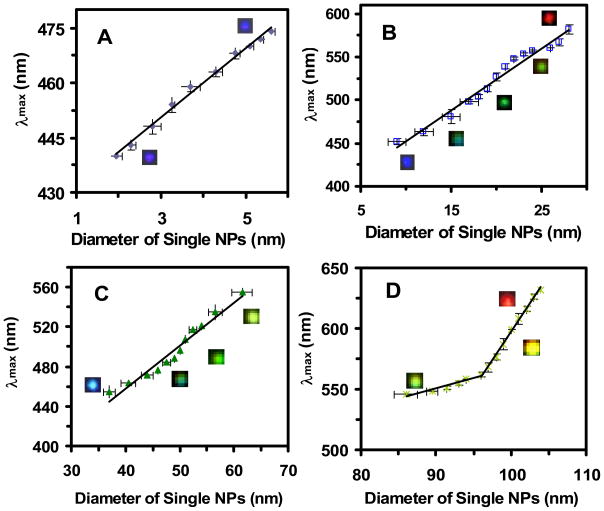
Figure 5.
Correlation of histograms of the distribution of λmax of LSPR spectra of single Ag NPs with histograms of the distribution of the sizes of single NPs to create optical nano rulers. Plots of distribution of λmax of LSPR spectra of single NPs (Figure 3c) versus their size distribution (Figure 1b) show size-dependent λmax of single NPs, for individual NP solution: (A) 3.1 ± 0.6, (B) 13.4 ± 5.8, (C) 46.4 ± 6.1, and (D) 91.1 ± 7.6 nm Ag NPs, respectively. Selected single NP optical images are embedded in the plots. More than 300 of single NPs were studied for each plot. The points with error bars represent the averages of experimental measurements with their standard deviations and the lines are fitted to the experimental results using least-squares linear regression. The linear regressions for (A–D) are 0.99, 0.98, 0.96, 0.92 and 1.0, respectively.

