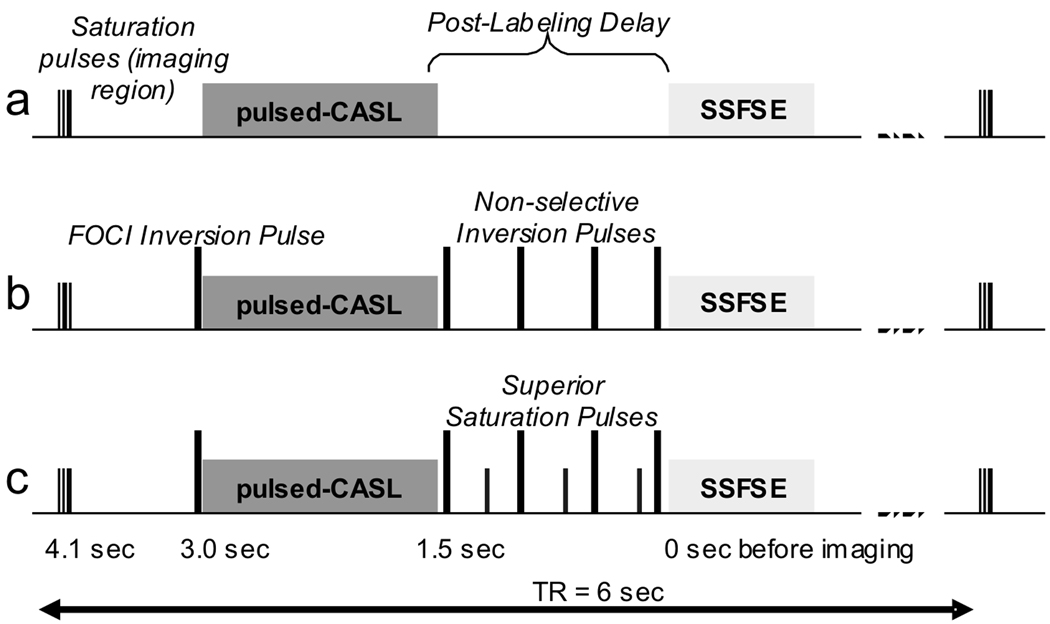
Figure 1.
The Pulse sequence diagram for ASL measurements. One 6-sec TR interval is shown, with time-before-imaging indicated: a) showing pulses for initial saturation of the imaging region (axially-orientated slab), pulsed-continuous labeling, the post-labeling delay, and a SSFSE image acquisition; b) the same with background suppression inversion pulses added (slab-selective FOCI pulse before labeling and the non-selective adiabatic inversion pulses after labeling); c) the same with pulses added for saturation of superior inflowing arterial blood.

