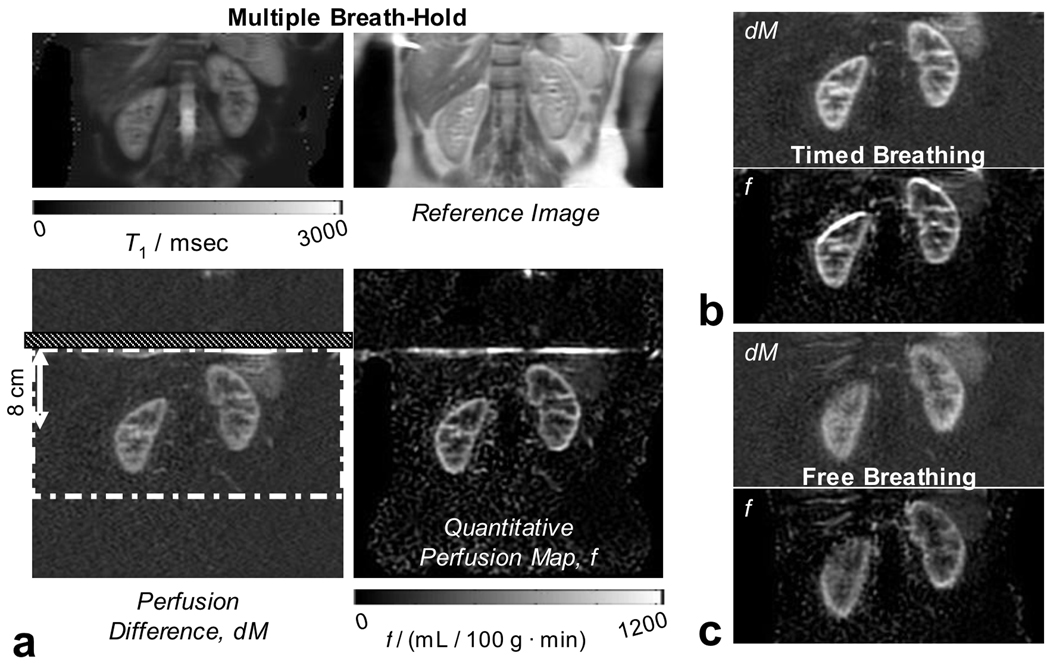
Figure 3.

Typical image quality in perfusion difference images and quantitative perfusion maps: a) the set of four images produced by the ASL experiment. Top left and right are the calculated T1 map and M0-image from the reference images. Bottom-left and right are the perfusion difference image (dM) and the quantitative perfusion map (f). Regions of higher and lower perfusion correspond to the cortical and medullary tissue structures in the kidney as also identified in the reference images. The dot-dash white line in the dM image is the axially-oriented imaging region, which is saturated prior to labeling as part of background suppression. The labeling plane, located at the superior edge of the imaging region, and orientated axially, is identified by the hatched section. All images were acquired with heavy background suppression. Breathing strategies were: in a) multiple breath-hold; in b) timed; and in c) free breathing. Good image quality is achieved in all images however (c) illustrates a case where bulk motion during free breathing introduces additional blurring.
