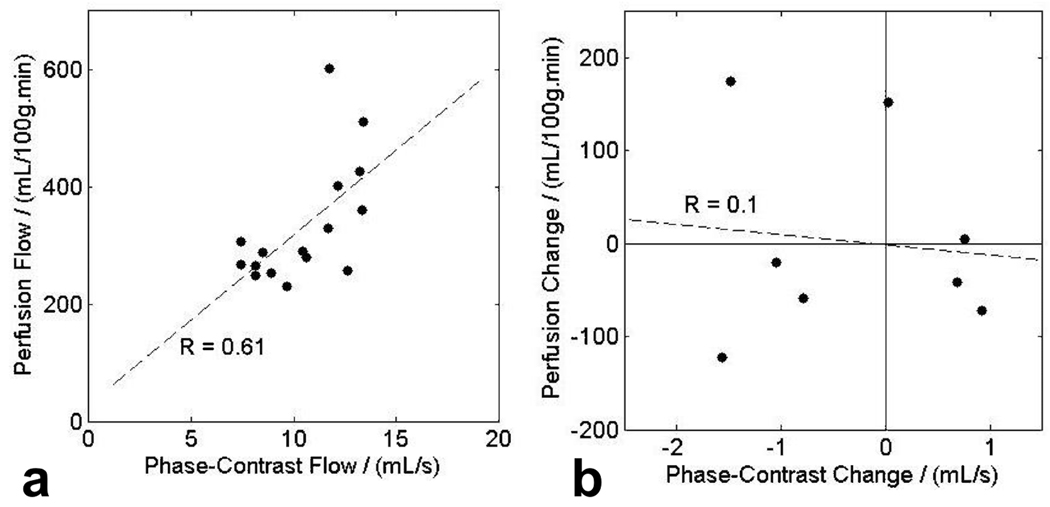
Figure 5.
a) Correlation between measured perfusion and measured total renal flow in both kidneys of four subjects at test and retest. There is a significant correlation (5% level), with correlation coefficient R = 0.61, slope 29 ± 10 (mL/100g.min)/(mL/s) and intercept 28 ± 111 (mL/100g.min)/(mL/s). b) Correlation between changes in flow measurements at test and retest; flow measured by perfusion and phase-contrast angiography. No significant correlation of changes is observed with R = 0.11 for 8 samples.

