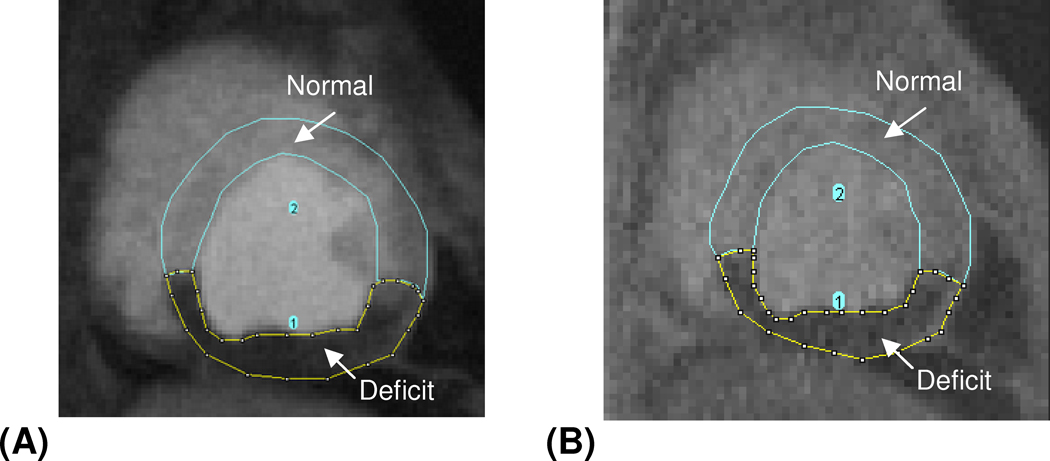
Figure 2.
A typical example showing the measurement of the perfusion deficits area and the total myocardial area from SW-CG-HYPR image (A) and turbo FLASH image (B). The area of flow deficits and normal myocardium was measured separately first, and the deficits percentage was calculated by dividing the area of deficits with the total myocardial area (the sum of area of normal myocardium and that of flow deficits).

