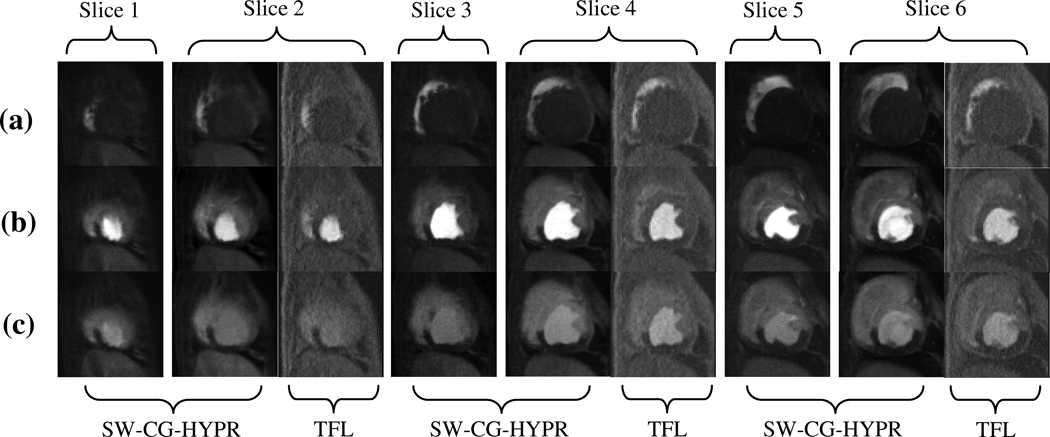
Figure 3.
A typical example showing the comparison of the perfusion images from SW-CG-HYPR and turbo-FLASH (TFL). With an R-R interval of 550 ms, SW-CG-HYPR method covered 6 slices compared to only 3 slices by conventional turbo-FLASH method. To compare the intensity changes and image quality, we matched the position of slice 2, 4 and 6 of SW-CG-HYPR images to the apex, mid-ventricular and basal images acquired with the conventional methods.

