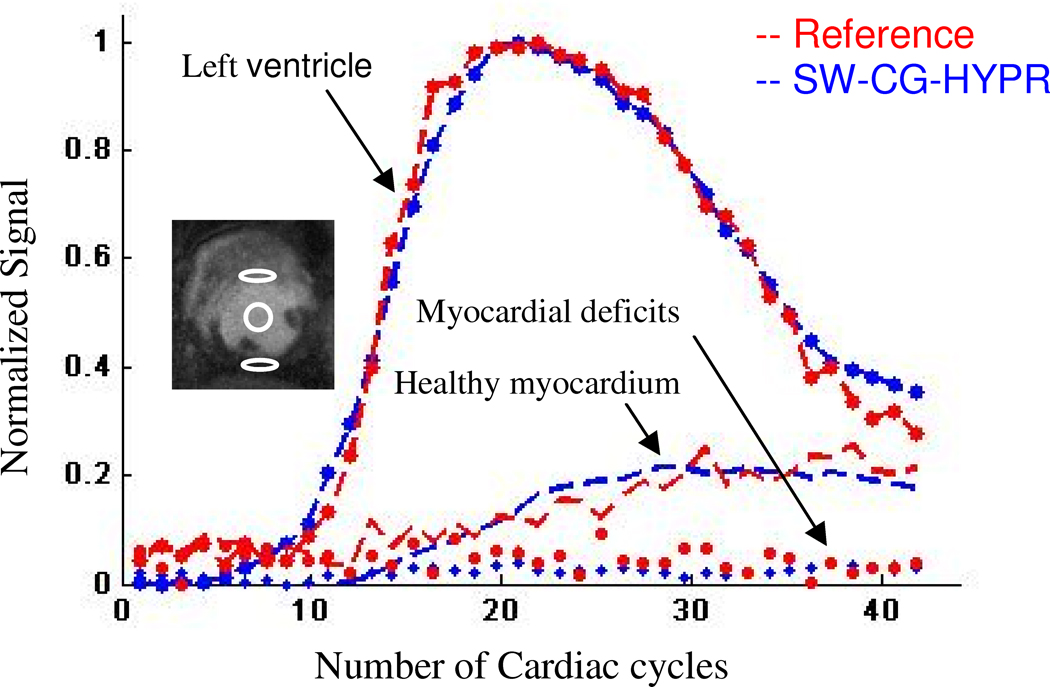
Figure 5.
A typical example of the SI comparison for left ventricular, healthy and ischemic myocardium between images from SW-CG-HYPR and EPI. The signal intensity changes of the two methods are highly correlated from each other. The ROIs used to measure the three groups of curves are shown in the inset image.

