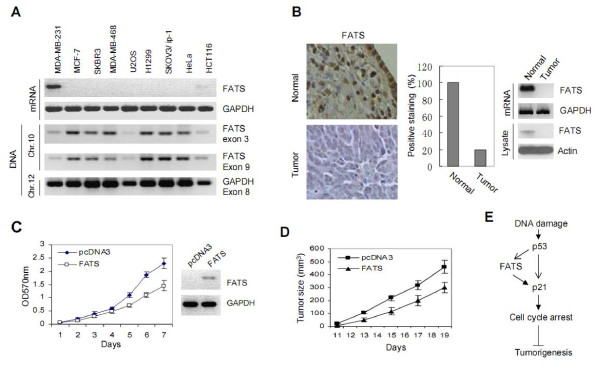
Figure 4.
The expression of FATS in human cancers and FATS-mediated tumor-suppressing activity. (A) The mRNA levels of FATS in human cancer cell lines. The primers for FATS expression: 5'-CAATAAGCGAAGCCCTGAAG-3' and 5'-TTGGAGAGCTATCCCCAATG -3'. The same amount of genomic DNA (0.05 μg) was used for PCR amplification (25 cycles) simulteneously. Primer sequences were as follows: 5'-GTGTCCACCTCAGGGTGTCT-3' and 5'-CTTCAGGGCTTCGCTTATTG-3' (FATS exon 3); 5'-CCCATCAGAGAGGCCTGATA-3' (FATS exon 9); 5'-ACCCAGAAGACTGTGGATGG-3' and 5'-TTCTAGACGGCAGGTCAGGT-3' (GAPDH exon 8). Chr., Chromosome. (B) Immunohistochemistry of FATS in ovarian cancer samples. Representative slide photography showing intense staining of normal ovarian section whereas negative staining in 80% (n = 15) tested ovarian cancer samples. The percentage of positive staining of FATS was showed in right panel. Normal, N; Tumor, T. The expression of FATS in normal ovarian tissues and ovarian tumor samples were also examined by RT-PCR and immunoblotting. The representative images were shown in the right panel. (C) The effect of FATS on the growth of HeLa cancer cells in vitro. HeLa cells were stably transfected with FATS and an empty vector pcDNA3 (Invitrogen), respectively. The growth rates of HeLa-FATS and HeLa-pcDNA3 cells were measured by MTT assay [5]. The expression of FATS in HeLa-FATS cells was shown in the right panel. (D) In vivo tumorigenicity analysis of HeLa-FATS and HeLa-pcDNA3 cells. Xenograft tumor volumes in SCID mice were measured (n = 10 mice per group) using the formula: Volume = S × S × L/2, where S is the short length of the tumor in mm and L is the long length of the tumor in mm. (E) Schematic representation showing that p53-mediated transactivation of FATS maximizes the effect on maintaining p21 abundance, leading to the suppression of tumorigenesis.

