Figure 2.
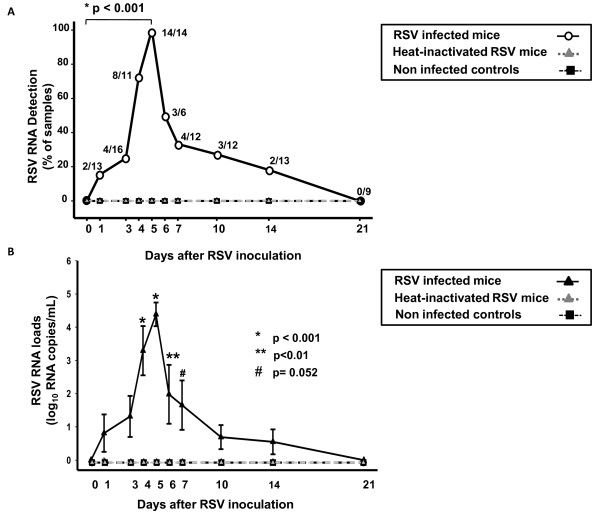
Time-course detection of RSV RNA in peripheral blood during Acute RSV disease. RSV RNA was measured in peripheral blood samples sequentially obtained in RSV infected mice, mice inoculated with heat-inactivated RSV and uninfected controls from day 1 to 21 post-inoculation. Mice inoculated with HI-RSV and non-infected controls did not have RSV RNA detected in the blood at any time point evaluated. Fig. 2. A The Y-axis represents the percentage of positive samples detected in each experimental condition and the X-axis the time points evaluated. Numbers at each time-point represent the ratio of positive RSV RNA samples/total number of RSV-infected mice evaluated. RSV RNA detected in blood significantly increased from day 1 to day 5 (Z-test, p < 0.001). Fig. 2. B. The Y-axis represents the peripheral blood RSV RNA loads in log10 copies/mL over time. Blood viral loads in mice infected with live-RSV gradually increased from day 1 to day 5 post-inoculation, the peak of viral detection and viral load quantification (One-way ANOVA p < 0.01).

