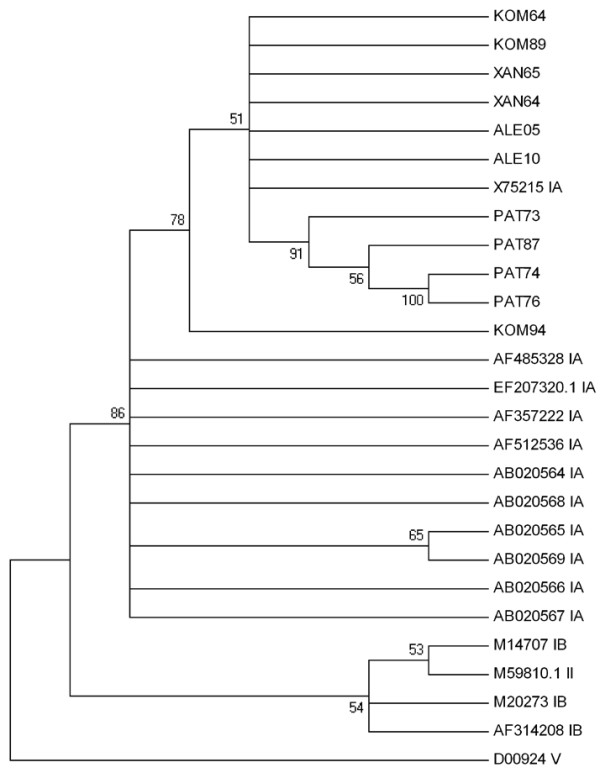
Figure 2.

Phylogenetic tree depicting the relationship between the clinical and the environmental HAV strains of the present study in relation to other isolates retrieved from the GenBank database. Numbers under branches are bootstrap percentage values, calculated from 1,000 bootstrap replicates. GenBank accession numbers of the reference sequences along with the corresponding genotypes or sub-genotypes are included in the phylogram.
