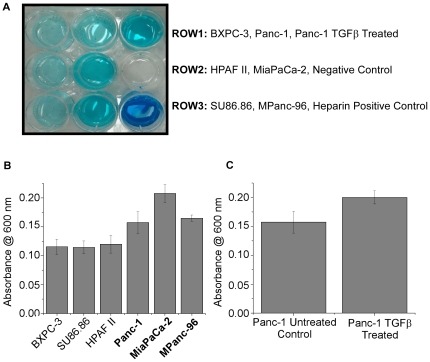
Figure 5. Alcian Blue assay for comparison of overall sulfation levels for selected pancreatic cancer cell lines.
An Alcian Blue assay was performed on lysates from the indicated cell lines, and the overall sulfation for each cell line was quantified by measuring the absorbance of the dye at 600 nm. A student's t-test (results given by the p value) was performed comparing the absorbances between the mesenchymal-like cell lines (in bold) and epithelial cell lines as well as between Panc-1 after 72 hours of TGFβ treatment and untreated Panc-1. Heparin was used as a sulfated GAG control. (A) Photograph of the resulting retention of Alcian Blue dye after the precipitation of sulfated glycans and subsequent re-suspension. The second column represents the mesenchymal-like cell lines and retained more stain, indicating the presence of higher levels of sulfated glycans in the cell lysates. (B) Bar graphs showing the differences in absorbance at 600 nm for the cell lines. The mesenchymal-like cell lines (in bold) had significantly higher levels of absorbance than the remaining epithelial cell lines (p = 1.29×10⁻⁵). (C) Bar graphs showing the differences in absorbance at 600 nm for Panc-1 after 72 hours exposure to 5 ng/mL TGFβ or untreated under serum starvation. Panc-1 after TGFβ treatment had significantly higher levels of absorbance than the untreated Panc-1 (p = 0.027).

