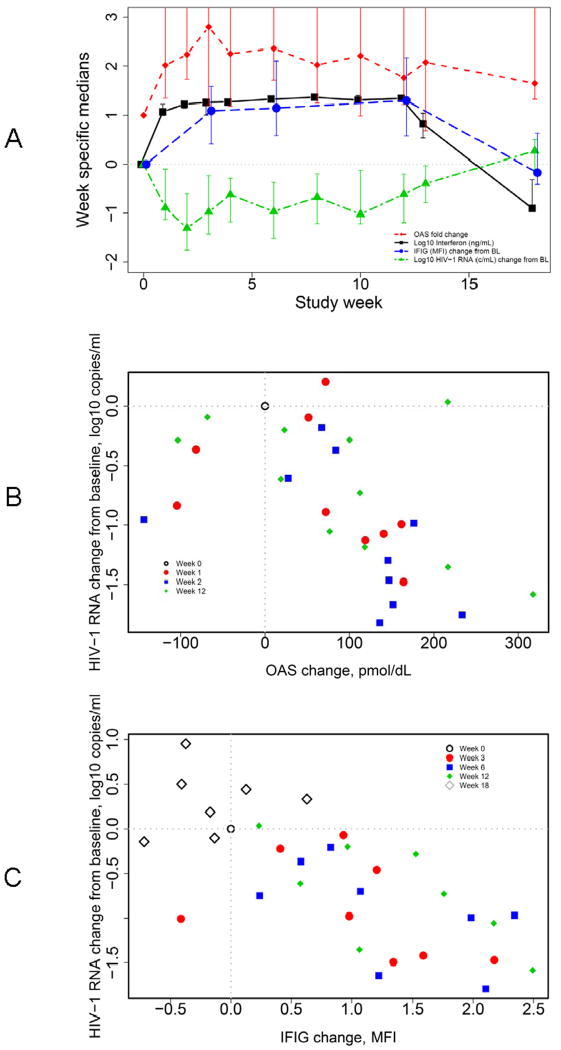
Figure 2.
A. Median log10 interferon (ng/mL; black squares, blacks solid line), median OAS change from baseline (fold-change; red diamonds, red broken line), median IFIG change from baseline (MFI; blue circles, blue dashed line) and median plasma HIV-1 RNA change from baseline (log10 copies/mL; green triangles, green broken line) plotted against study week. Intervals represent 90% CIs around medians. Y-axis truncated at 2.5. OAS fold-change CIs: week 1 (1.3 to 4.8), week 2 (1.7 to 8.0), week 3 (1.2 to 5.7), week 4 (1.2 to 5.0), week 6 (1.7 to 4.4), week 8 (1.2 to 7.7), week 10 (1.0 to 7.7), week 12 (1.2 to 4.5), week 13 (0.7 to 3.9) and week 18 (1.3 to 3.4).
B. Scatterplot of subject-specific changes in viral load against concurrent changes in OAS protein at week 0 (open black circle), week 1 (filled red circle; estimated Spearman correlation r = −0.75 [− 0.93, −0.28]), week 2 (blue square; r = −0.61 [− 0.87, −0.09]), and week 12 (green diamond; r = −0.51 [CI: −0.81, 0.02]).
C. Scatterplot of subject-specific changes in viral load against changes in IFIG at week 0 (open black circle), week 3 (filled red circle; r = -0.62 [90% CI -0.90, 0.02]), week 6 (blue square; r = -0.64 [-0.90, -0.02]), week 12 (green diamond; r = -0.74 [-0.93, -0.21]) and week 18 (open gray diamond; r = 0.07 [−0.64, 0.71]).

