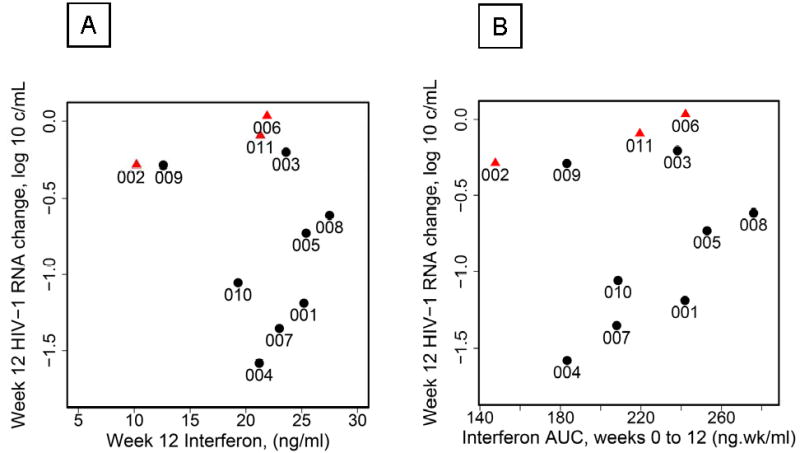
Figure 3.

A. Week 12 plasma HIV-1 RNA changes from baseline (average of pre-entry and entry, log10 copies/mL) plotted against week 12 plasma concentrations for pegylated interferon alpha-2a. Red triangles, 3 subjects with reduced dosing; black circles, remaining subjects; estimated Spearman correlation r = −0.11 (90% CI −0.60 to 0.44).
B. Week 12 plasma HIV-1 RNA changes from baseline (average of pre-entry and entry, log10 copies/mL) plotted against area under the concentration-time curve (weeks 0-12) for interferon. Red triangles, 3 subjects with reduced dosing; black circles, remaining subjects; r = 0.16 (90% CI, −0.39 to 0.63)
