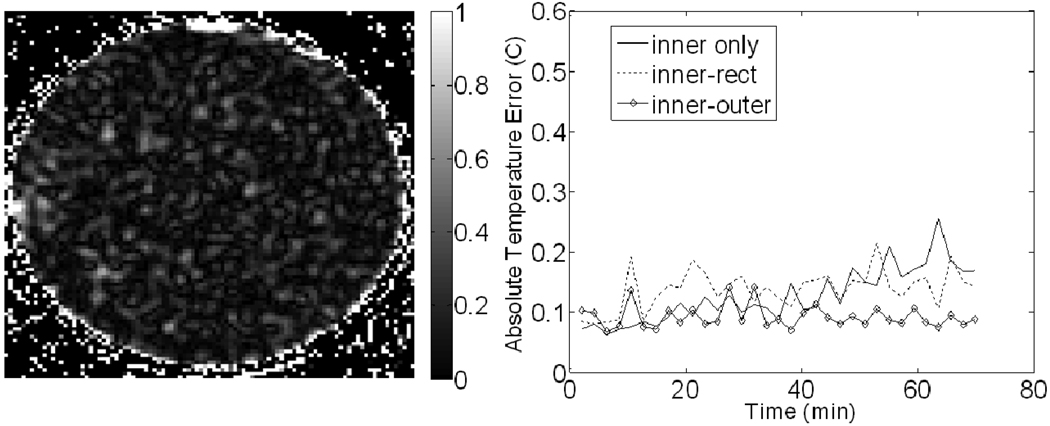
Figure 6.
Results from the MAPA phantom experiment. (Left) Image of the final temperature error (in °C) after correction using the inner-outer reference combination. (Right) Plots of the absolute temperature error for each correction scheme over time. The definition of each reference combination can be found in the methods and Figure 3.

