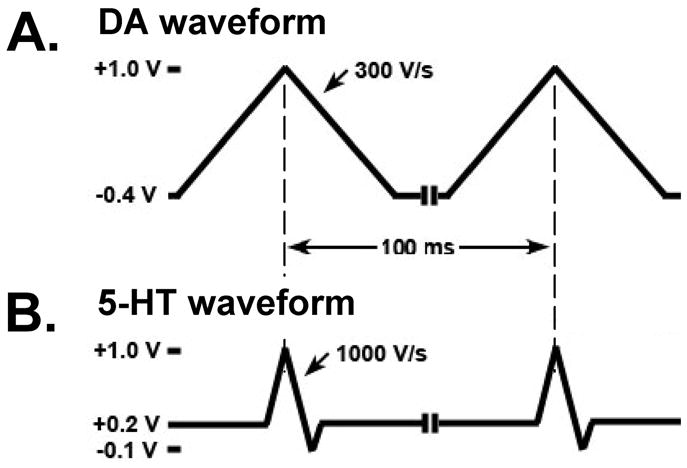
Figure 1. FSCV waveform comparison.

A. DA waveform consisting of a resting potential of −0.4 V scanned to +1.0 V and back to −0.4 V and a scan rate of 300 V/s. B. 5-HT waveform consisting of a resting potential of +0.2 V scanned to +1.0 V, then to −0.1 V and back to +0.2 V and a scan rate of 1000 V/s.
