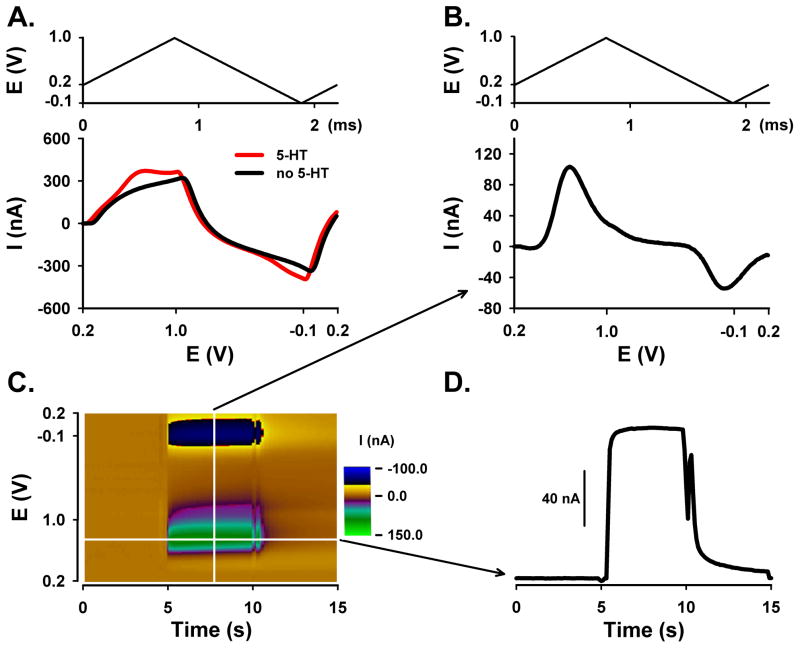
Figure 3. 5-HT waveform for the detection of 5-HT using flow injection analysis.
A. Background current with (red) and without (black) 5-HT plotted with voltage unfolded linearly (bottom panel) with 5-HT waveform (top panel). B. Background-subtracted linear (unfolded) voltammogram (bottom panel) with 5-HT waveform (top panel). C. Pseudo-color plot (10 μM 5-HT). D. Current measured at the peak oxidative potential for 5-HT during the bolus injection and plotted with time.

