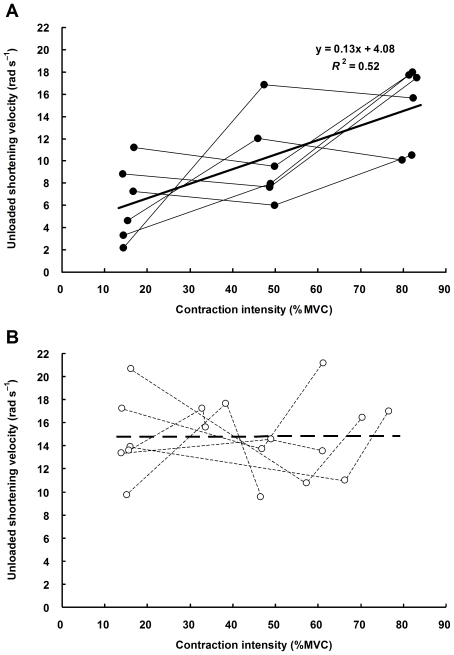
Figure 6. Relations between contraction intensity and unloaded shortening velocity (V 0) of human dorsiflexors during voluntary (A) and electrically-elicited (B) contractions.
Shown are individual line plots from 6 subjects. Contraction intensity is expressed as a percentage of maximal voluntary contraction (MVC). V 0 of voluntarily activated muscle significantly increased with increasing contraction intensity (solid line: R 2 = 0.52, n = 18, P<0.001), whereas that of electrically activated muscle did not (dashed line: R 2<0.001, n = 18, P = 0.98).

