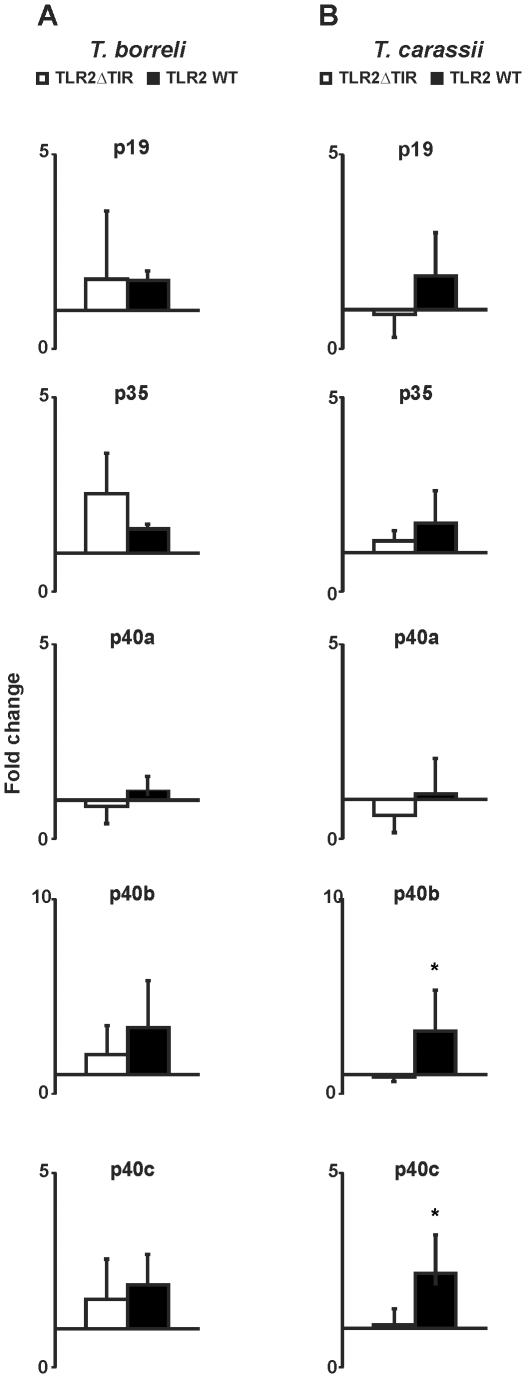
Figure 4. Overexpression of TLR2 in carp macrophages.
TLR2ΔTIR- and TLR2WT-transfected carp macrophages were stimulated with live T. borreli or T. carassii parasites (0.25 million parasites per well) for 6 h, or left untreated as negative control. mRNA levels of IL-12 family members were normalized against the house keeping gene 40S ribosomal protein S11 and are shown as fold change relative to unstimulated macrophages (fold change = 1). Bars show averages + SD of n = 4 fish. Symbol (*) represents a significant (P≤0.05) difference in gene expression between parasite-stimulated cells macrophages in TLR2WT-transfected- compared to TLR2ΔTIR- transfected carp macrophages.

