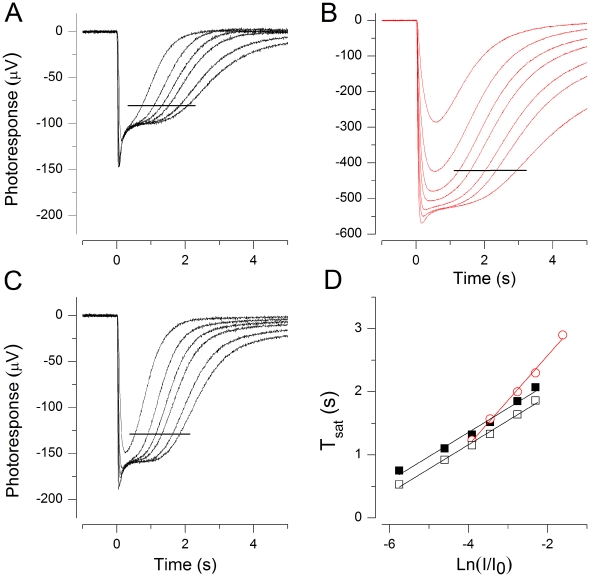
Figure 2. Dominant time constant τD is reversibly increased in low Ca2+.
(A–C) Mouse ERG flash responses at 25°C in normal Ringer (A and C) and in 25 nM free Ca2+ (B). Flash strengths were 173, 548, 1100, 1730, 3460, 5480, (11 000, only in B) Rh*. Data used for τD determinations are indicated by horizontal lines. (D) Pepperberg plots extracted from A–C: τD was 383 ms before (▪) and 382 ms after (□) low Ca2+ (25 nM) exposure. In low Ca2+ τD was 710 ms (red ○).

