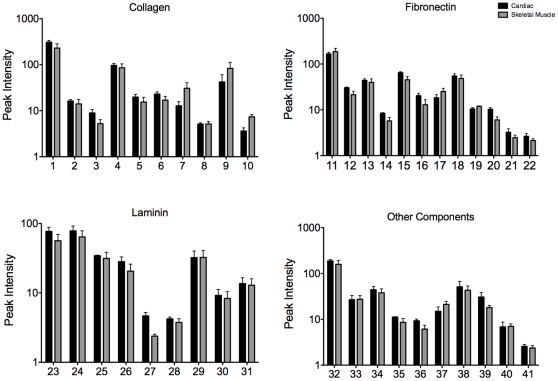
Figure 4. Peak value data of functional groups of cardiac matrix and skeletal muscle matrix coatings.
ToF-SIMS peak analysis of cardiac matrix versus skeletal muscle matrix coated tissue culture plastic. The amino acid signatures from the peak values indicate that post adsorption the different matrices retain their complexity with multiple ECM components. See Table 2 for individual peak descriptions.

