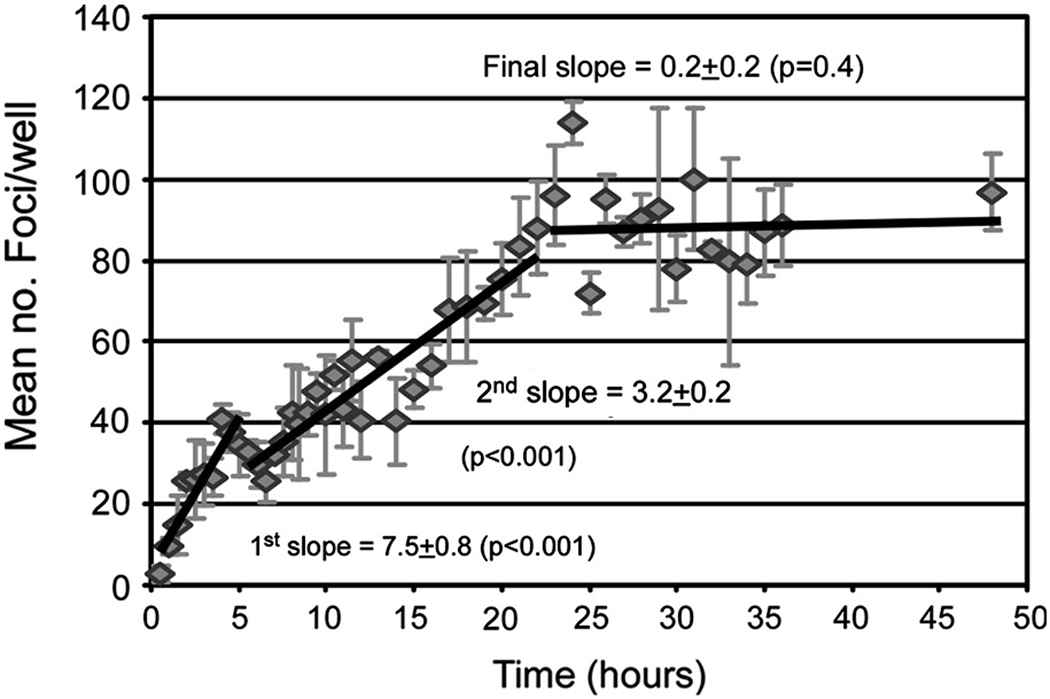
Fig. 1. Multi-phasic time course of HCVcc infection initiation in Huh7 cells.
Huh7 cells were plated in 96-well plates and cultures infected with ~ 100 FFU of HCVccwt. At indicated time points p.i., inoculum was removed from triplicate wells, cells were washed twice with 1X PBS and overlaid with 10% cDMEM containing 0.25% methylcellulose. Forty-eight hours p.i., HCV foci were visualized by HRP-based immunocytochemistry staining using an anti-NS5A antibody, quantified and are expressed as mean number (no.) of foci detected/well ± standard deviation (stdev) for triplicate samples. The slope of foci increase for each of the three phases of HCVcc foci formation were calculated (solid lines). p≤0.05 represents foci slope different than zero.

