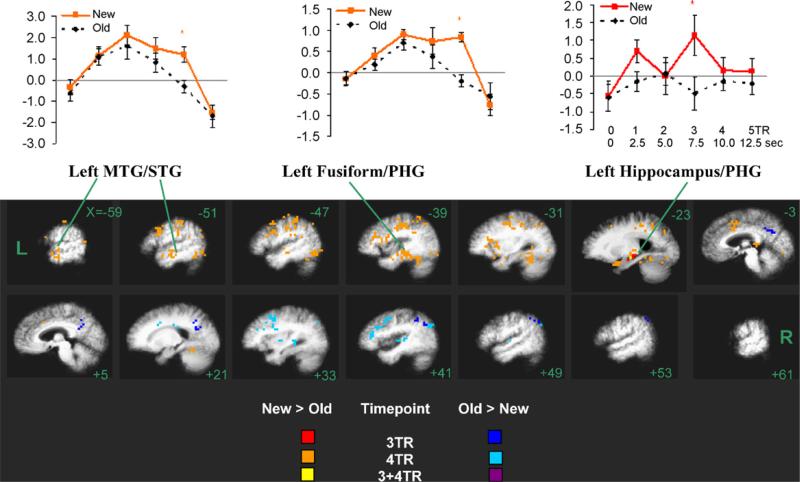
Fig. 1.
Maps of the congruous repetition effect on BOLD response and estimates of the hemodynamic response function (HRF) shown for New and Old congruous words. Clusters of voxels with significant New > Old BOLD (‘hot’ colors) and Old > New BOLD (‘cold’ colors) effects at 3- and 4-TR timepoints are shown (see key for color scheme) superimposed on the group-averaged (n = 17) anatomical image. Slices are labeled with Talairach x-coordinates. HRF estimates for selected clusters are shown above; error bars indicate standard error across subjects. *p < 0.05; PHG = parahippocampal gyrus, MTG = middle temporal gyri, STG = superior temporal gyri.

