
Fig. 2.
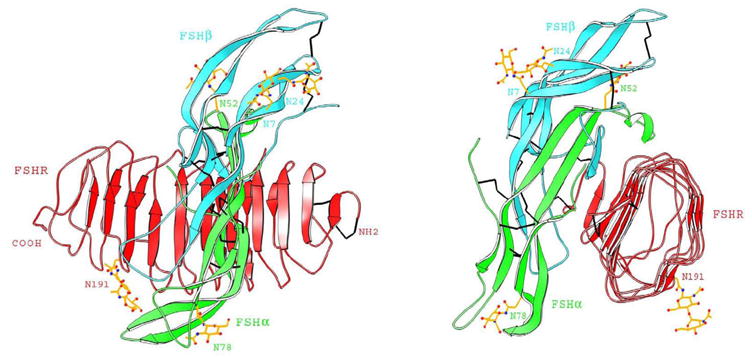
Crystal structure of the FSH-FSHR ECD complex. Two views of the complex, rotated by 90° about the vertical axis, are shown. The ECD is presented as red, and the FSH α and β chains are in green and cyan, respectively. The structure of the complex depicts the large contact surface area accompanying hormone-receptor binding and shows that both subunits contribute to receptor interaction. The figure was kindly provided by Dr. W.A. Hendrickson and is reproduced with permission from Macmillan Publishers Ltd.: Nature (Fan and Hendrickson, 1995).