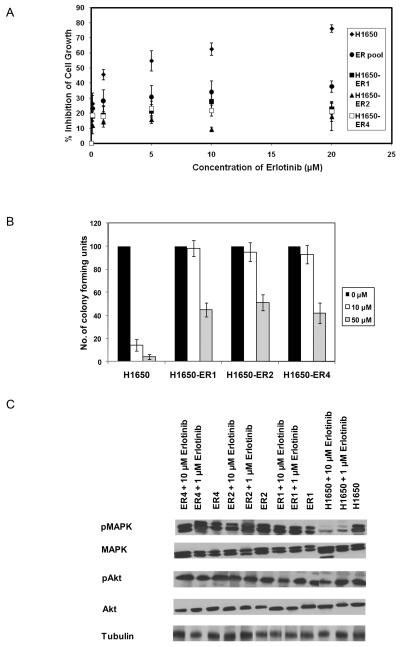
Figure 3.
Establishment and characterization of erlotinib-resistant H1650 cells. (A) Dose-response curves of parental H1650 cells, a resistant pool, and clones isolated from the resistant pool following incubation with varying concentration of erlotinib for 48 hr. (B) Colony formation assay: H1650, H1650-ER1, H1650-ER2 and H1650-ER4 cells were seeded at a density of 25 cells per well in 6 well plates and cultured in the presence of varying concentration of erlotinib. After 15 days, the number of colonies was counted. Only colonies containing at least 50 cells were counted. Numbers of colony forming units in the treated cells were expressed as percentages of untreated cells. (C) Extracts of the cells treated with 0, 1 and 10 μM erlotinib for 5 hr and were analyzed for phospho and total MAPK and Akt by Western blot. Each data point represents the mean of three (A) or two (B) independent experiments. The error bars represent s.e.m.

