
Figure 4.
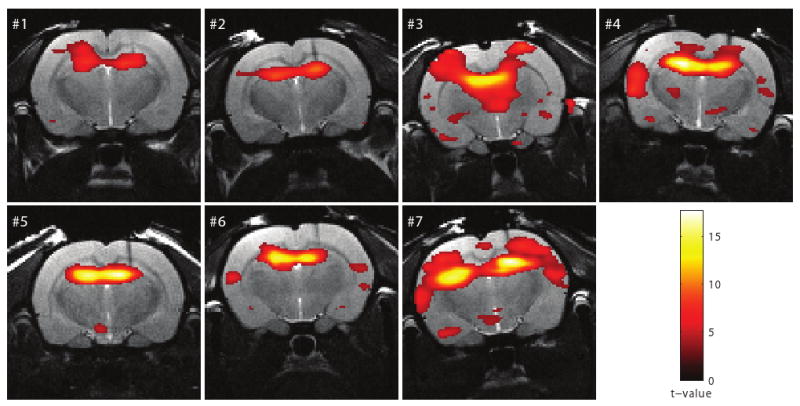
Activation maps (Rat # 1-7) in response to kainic acid induced seizures superimposed on the anatomical images. The threshold for statistical significance was set at p ≤ 0.05 (FWE corrected).
Official websites use .gov
A
.gov website belongs to an official
government organization in the United States.
Secure .gov websites use HTTPS
A lock (
) or https:// means you've safely
connected to the .gov website. Share sensitive
information only on official, secure websites.
Activation maps (Rat # 1-7) in response to kainic acid induced seizures superimposed on the anatomical images. The threshold for statistical significance was set at p ≤ 0.05 (FWE corrected).