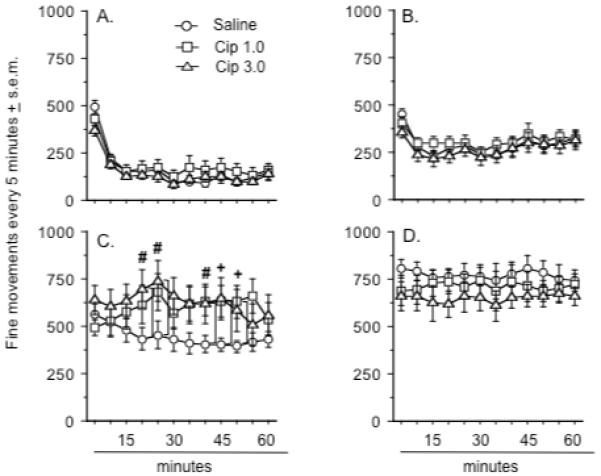
Figure 2.

Effects of ciproxifan pretreatment on the number of fine movements seen after treatment with: A.) saline treatment, B.) MK-801 0.05 mg/kg, C.) MK-801 0.1 mg/kg, and D.) MK-801 0.3 mg/kg. A plus sign (+) indicates a significant difference between the saline and Cip 1.0 dose group. A number sign (#) indicates a significant difference between the saline and Cip 3.0 dose group. Group differences refer to outcomes of post-hoc comparisons that were significant at p ≤ .05 (Fishers PLSD) and are indicated by connecting lines. Data represent the mean number of photobeam breaks every five minutes ± s.e.m. There were 12 animals in each group although a separate cohort of 12 rats was used to generate the data depicted in d.
