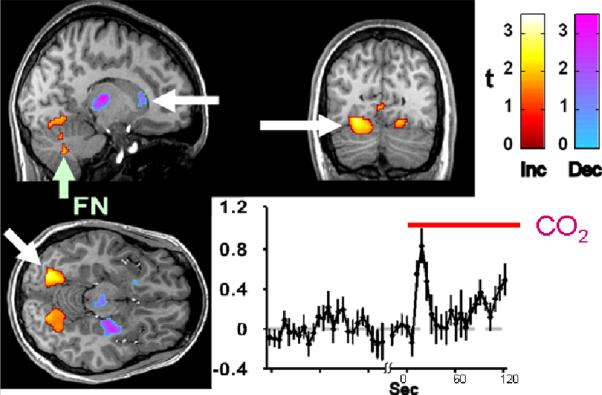
Figure 4.
fMRI responses to 5% CO2/95% O2 (red bar) in control adolescents. Signal increases in yellow-red scale appear in the cerebellar cortex as indicated with arrows. “FN” is cerebellar fastigial nucleus. Signal decreases in blue-green scale appear in the caudate nucleus, posterior thalamus, hippocampus and medial midbrain. Adapted from Harper et al. (2005), reproduced with permission.

