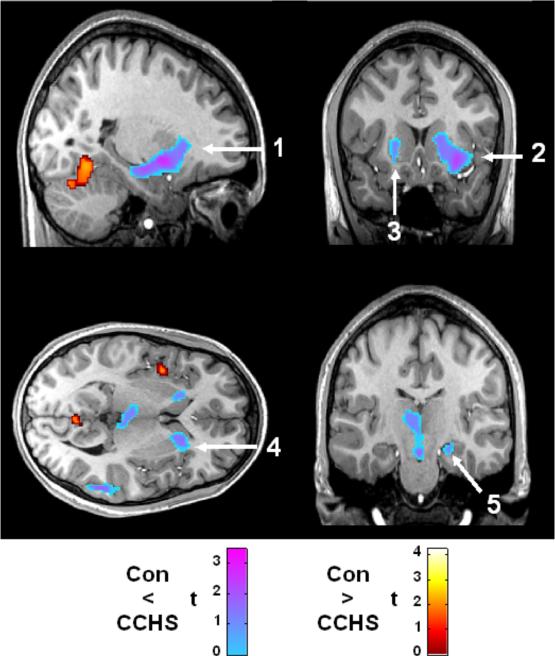
Figure 6.
fMRI responses to 5% CO2 in CCHS subjects relative to control adolescents, demonstrating other significant clusters of enhanced signals. In CCHS subjects, signal increases (yellow-red scale) appear unilaterally in the insula and cerebellar cortex. Arrows indicate response differences in globus pallidus, putamen, and thalamus (1, 2, 3), caudate (4), and hippocampus (5). Color coding of responses as in Figure 4. Adopted from Harper et al. (2005), reproduced with permission.

