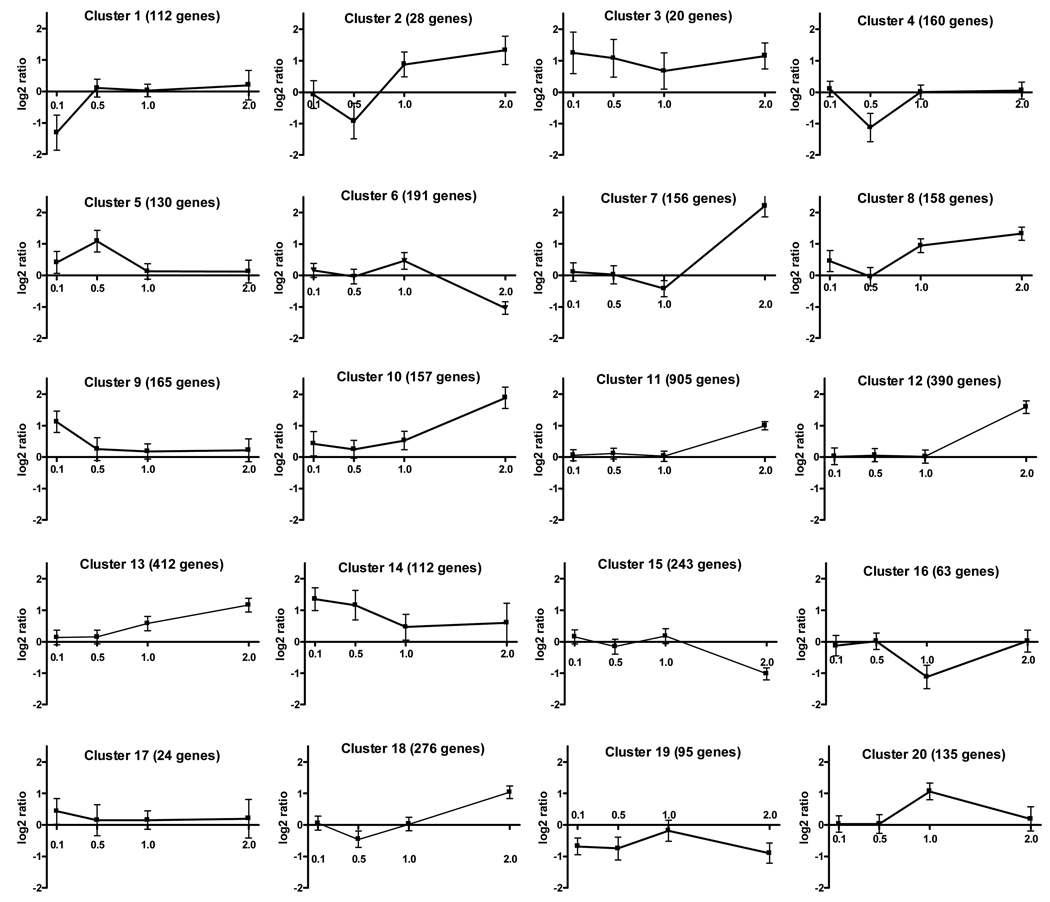
Figure 3. K-means cluster analysis of gene expression changes.
K-means cluster analysis was conducted on the 3,932 genes which were differentially expressed. On the X-axis different dosages are shown and on the Y-axis the log2 ratios of gene expression are provided. The Genesis program generated twenty clusters, with the greatest number of gene changes noted in the 2 mg/kg CPF dosage group in clusters 11>13>12>18 (ranked according to number of genes included in each, as shown in the title of each plate).

