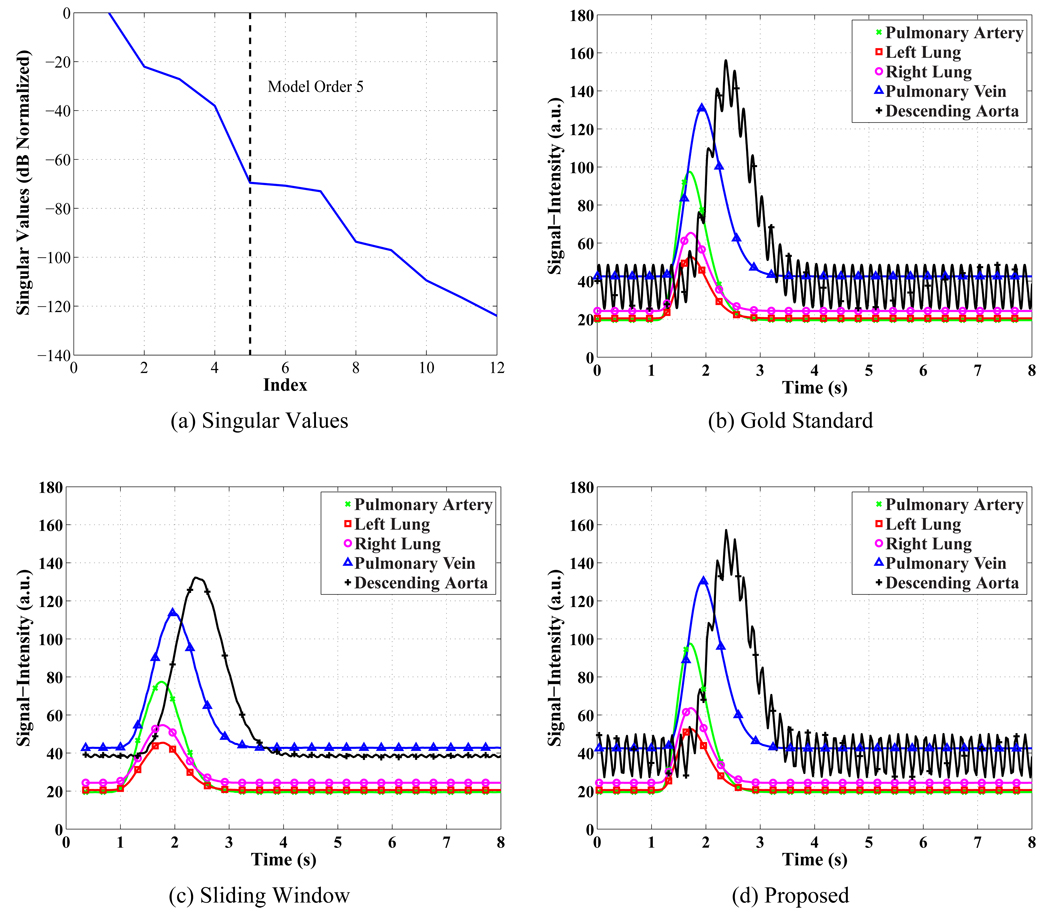
Figure 3.
Results from the pulmonary perfusion simulation reconstructed using the proposed method and the sliding window method. (a) The singular values of the training data normalized by the square root sum of squares of the singular values and converted to dB. The 6th singular value has a normalized value of −70.8 dB or 0.029%. (b) The gold standard signal-intensity curves shown at 4 ms resolution. (c) The sliding window signal-intensity curves have a normalized RMSE between 7 and 15%. The curves have been reconstructed at 32 ms spacing with a 720 ms sliding window. (d) The proposed method’s signal-intensity curves have a normalized RMSE between 0.4 and 3.2%. The curves have been reconstructed at 32 ms resolution.

