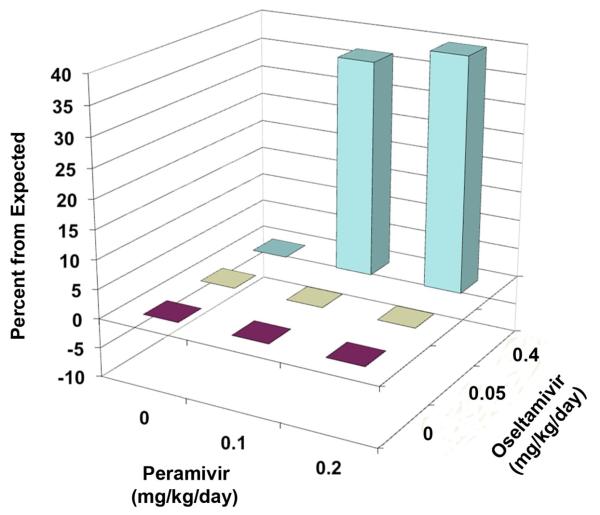
Figure 5.
Three-dimensional plot of the impact of oseltamivir and peramivir on the number of surviving mice from an influenza A/NWS/33 (H1N1) virus infection. This second experiment used large group sizes for greater statistical power. The MacSynergy plot was derived from the data in Table 4. Two points of synergy were significant at the 95% confidence limit.

