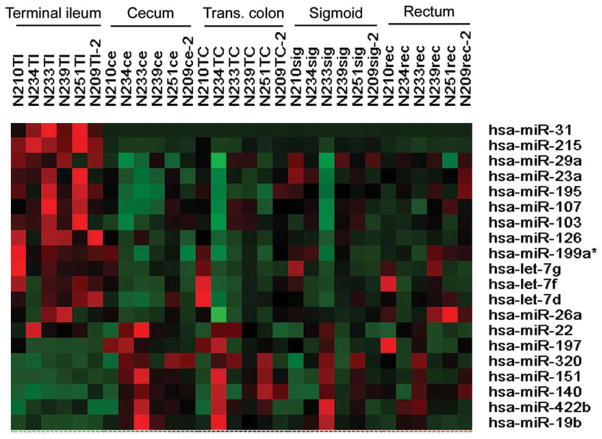
FIGURE 1.
Heatmap of differential miRNA expression in the normal gut. Twenty miRNAs were identified in the miRNA microarray profiling of intestinal regions from six consecutive patients. Red indicates higher than mean intensity (black) across all samples, green represents lower than mean intensity (black).

