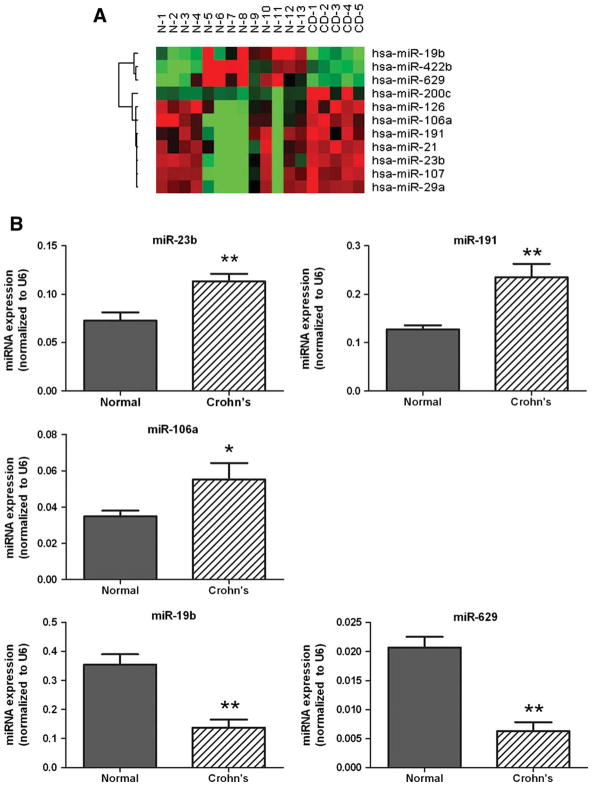
FIGURE 3.
Identification of active colonic CD-associated miRNAs. (A) Heatmap of 11 miRNAs identified by miRNA microarray as differentially expressed in colonic CD. Red indicates higher than mean intensity (black) across all samples, green represents lower than mean intensity (black). (B) Mature miRNA qRT-PCR validation of five miRNAs differentially expressed in colonic CD. Data are presented as mean ± SEM (*P < 0.05).

