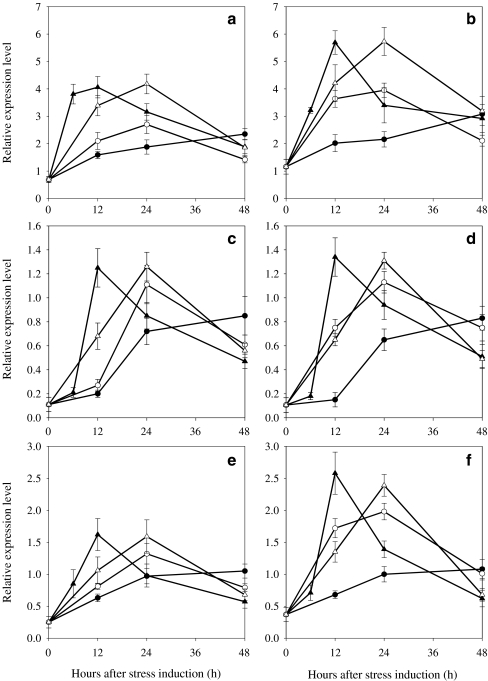
Fig. 4.
Relative expression profile of ipi, psy, pds of Haematococcus pluvialis WT (a, c, e) and MT 2877 (b, d, f) under different PFDs. Relative amounts were calculated and normalized with respect to one thousandth of 18S gene transcript levels. Data shown represent mean values obtained from three independent experiments (including RNA isolation, cDNA synthesis followed by real-time PCR assay), and the error bars indicate the SD of the mean. Note that different scales are used in graphs (a and bipi, c and dpsy, e and fpds, filled circle 50 μmol photons m−2 s−1, empty circle 125 μmol photons m−2 s−1, filled upright triangle 300 μmol photons m−2 s−1, empty upright triangle 600 μmol photons m−2 s−1)

