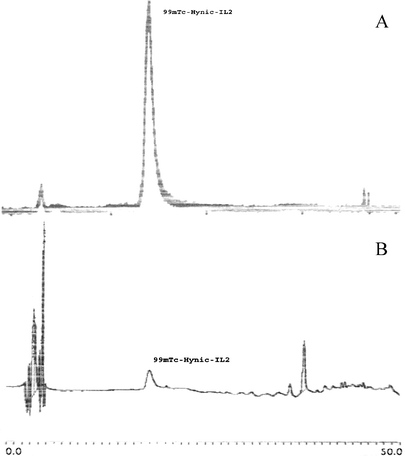
Fig. 4.

Chemical characterization of 99mTc-HYNIC-IL2 by reverse-phase HPLC. Both, the radiochromatogram (elution profile a) and the UV chromatogram (elution profile b) are presented. The peak at 18.013 min showed all the activity bound to 99mTc-HYNIC-IL2 and corresponds to the UV peak for HYNIC-IL2. In the UV profile, the peak at 37.418 min is due to a dimerization of HYNIC-IL2 that may occur because of the HPLC running buffer in which IL2 was diluted, with no corresponding radioactive peak. The peak eluted at early time in the radioactive profile is due to a little percentage of free 99mTc-tricine.
