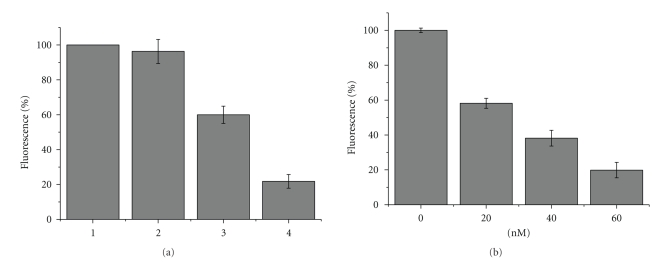
Figure 5.
Fluorescence intensity of the real-time hAGT assay, measured at excitation and emission wavelengths of 485 nm and 535, respectively. (a) Illustration of the different controls with 5 nM MB-5-O6-MeG-TBA: (1) Positive control of MB-5-O6-MeG-TBA in the absence of hAGT; (2) Intensity in presence of the inactive mutant hAGT-C145S; (3) Decrease in fluorescence when adding 40 nM active hAGT; and (4) basal fluorescence of 5 nM of MB-TBA. (b) Decrease in intensity caused by the activity of hAGT at a range of concentrations (0, 20, 40, and 60 nM), in all of them the basal fluorescence of MB-TBA was subtracted.

