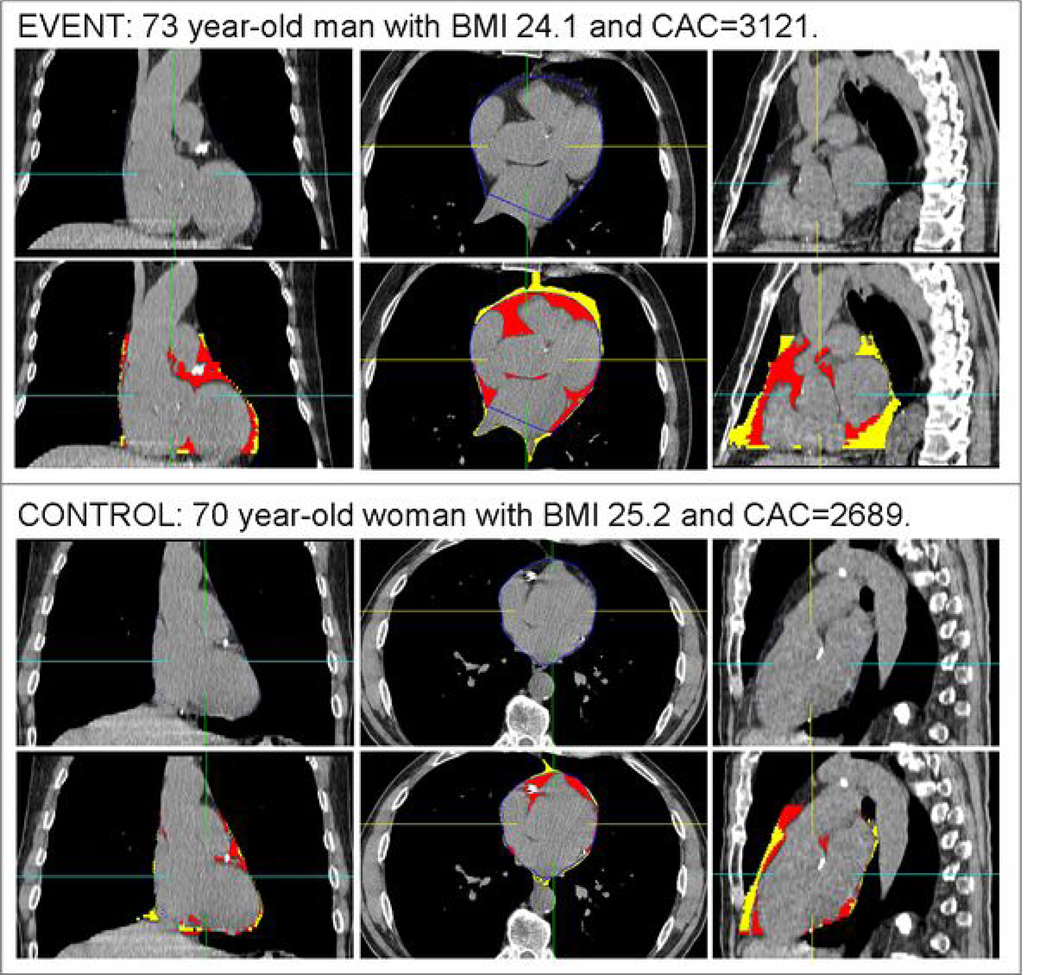
Figure 3.
A representative example of pericardial fat volume (PFV) and thoracic fat volume (TFV) quantification in matched patients with very high coronary calcium scores (CCS). Within each panel, the top row shows standard coronal, axial, and sagittal (left to right) CT displays of the heart, and the bottom row shows the same images with superimposed detection of pericardial fat (red) and thoracic fat (red and yellow). Top panel images are from a 73 year-old man with a CCS of 3121 who suffered a nonfatal myocardial infarction 99 days after the noncontrast CT. His PFV was 170 cm3 and TFV was 329 cm3. Bottom panel images are from a matched 70 year-old event-free man with a CCS of 2689. His PFV was 78 cm3 and TFV was 137 cm3.

