
Figure 2.
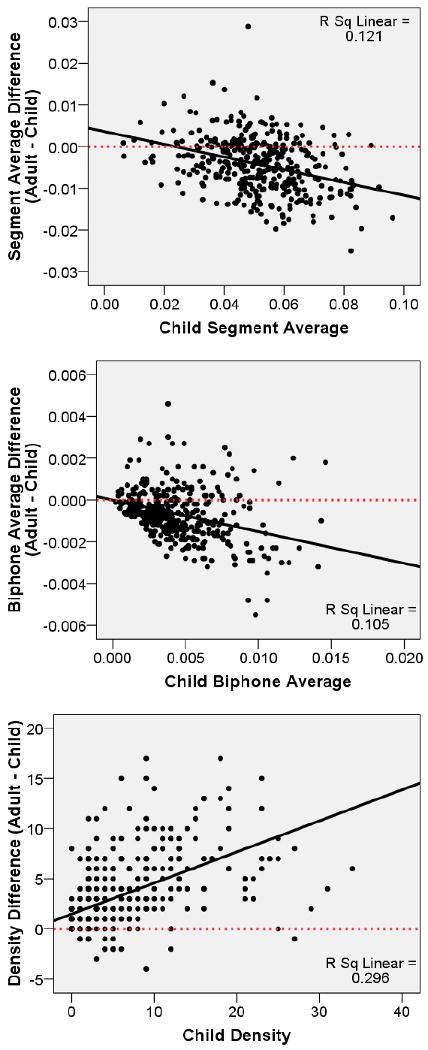
Scatter plots of difference scores (adult – child) versus child positional segment average (top), biphone average (middle), and neighborhood density (bottom). Solid line indicates the linear regression fit line. Dashed line is a reference line indicating a difference score of zero (i.e., adult = child). Points falling below the line (i.e., a negative difference score) indicate that the child value is higher than the adult value. Points falling above the line (i.e., a positive difference score) indicate that the child value is lower than the adult value.