
Figure 4.
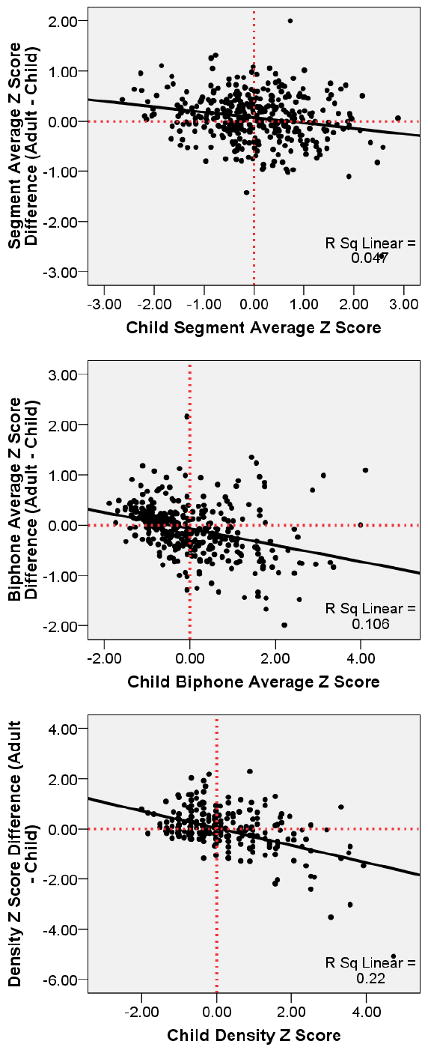
Scatter plots of z score difference (adult – child) relative to the child positional segment average z score (top), the child biphone average z score (middle), and the child neighborhood density z score (bottom). Solid line indicates the linear regression fit line. Horizontal dashed line is a reference line indicating a difference score of zero (i.e., adult = child). Points falling below the line (i.e., a negative difference score) indicate that the child value is higher than the adult value. Points falling above the line (i.e., a positive difference score) indicate that the child value is lower than the adult value. Vertical dashed line indicates a z-score of 0.00, differentiating low probability or density (values below 0.00) from high (values greater than 0.00).