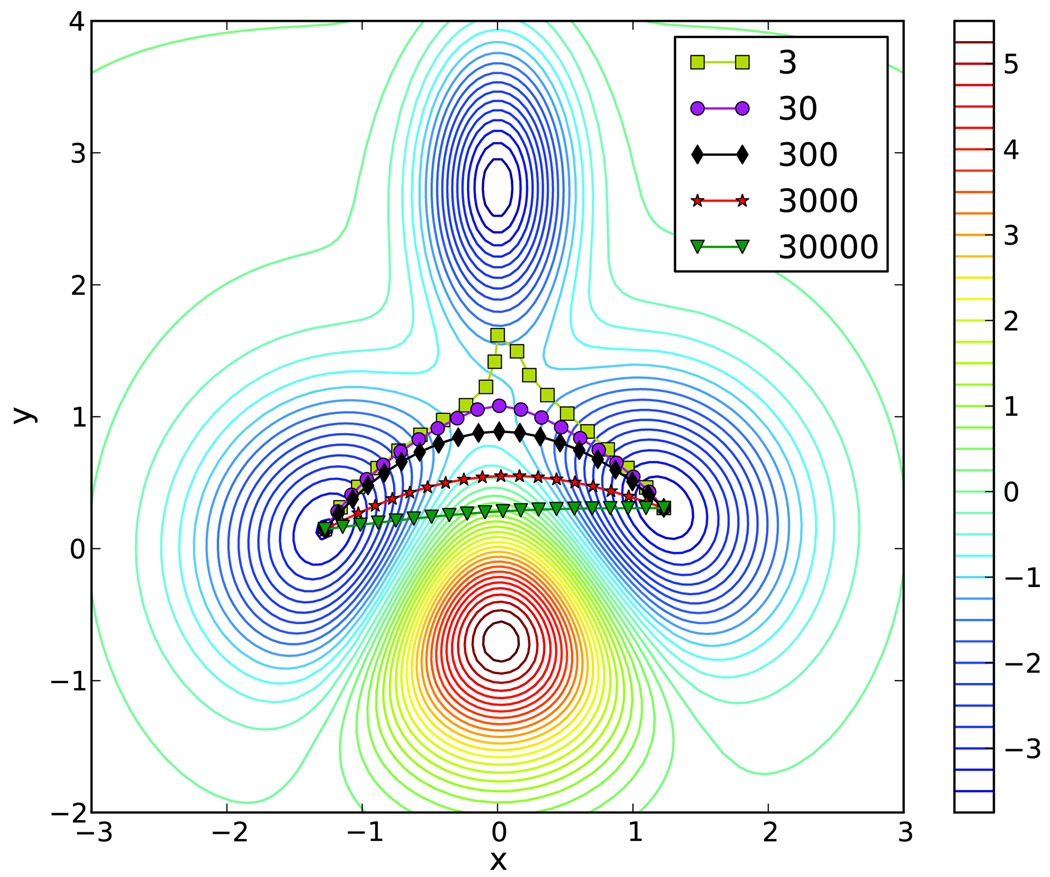
Figure 4.
Maximum flux transition path obtained using the semi-implicit simplified string method. Here we used the same initial path and the same stopping criterion for convergence as for Figure 3. The MFTPs are generated using 20 images at 3 K, 30 K, 300 K, 3000 K, 30000 K, respectively (which roughly correspond to β−1 = 0.006,0.06,0.6,6,60 kcal/mol.) The contour lines are separated by 0.25 kcal/mol.

